
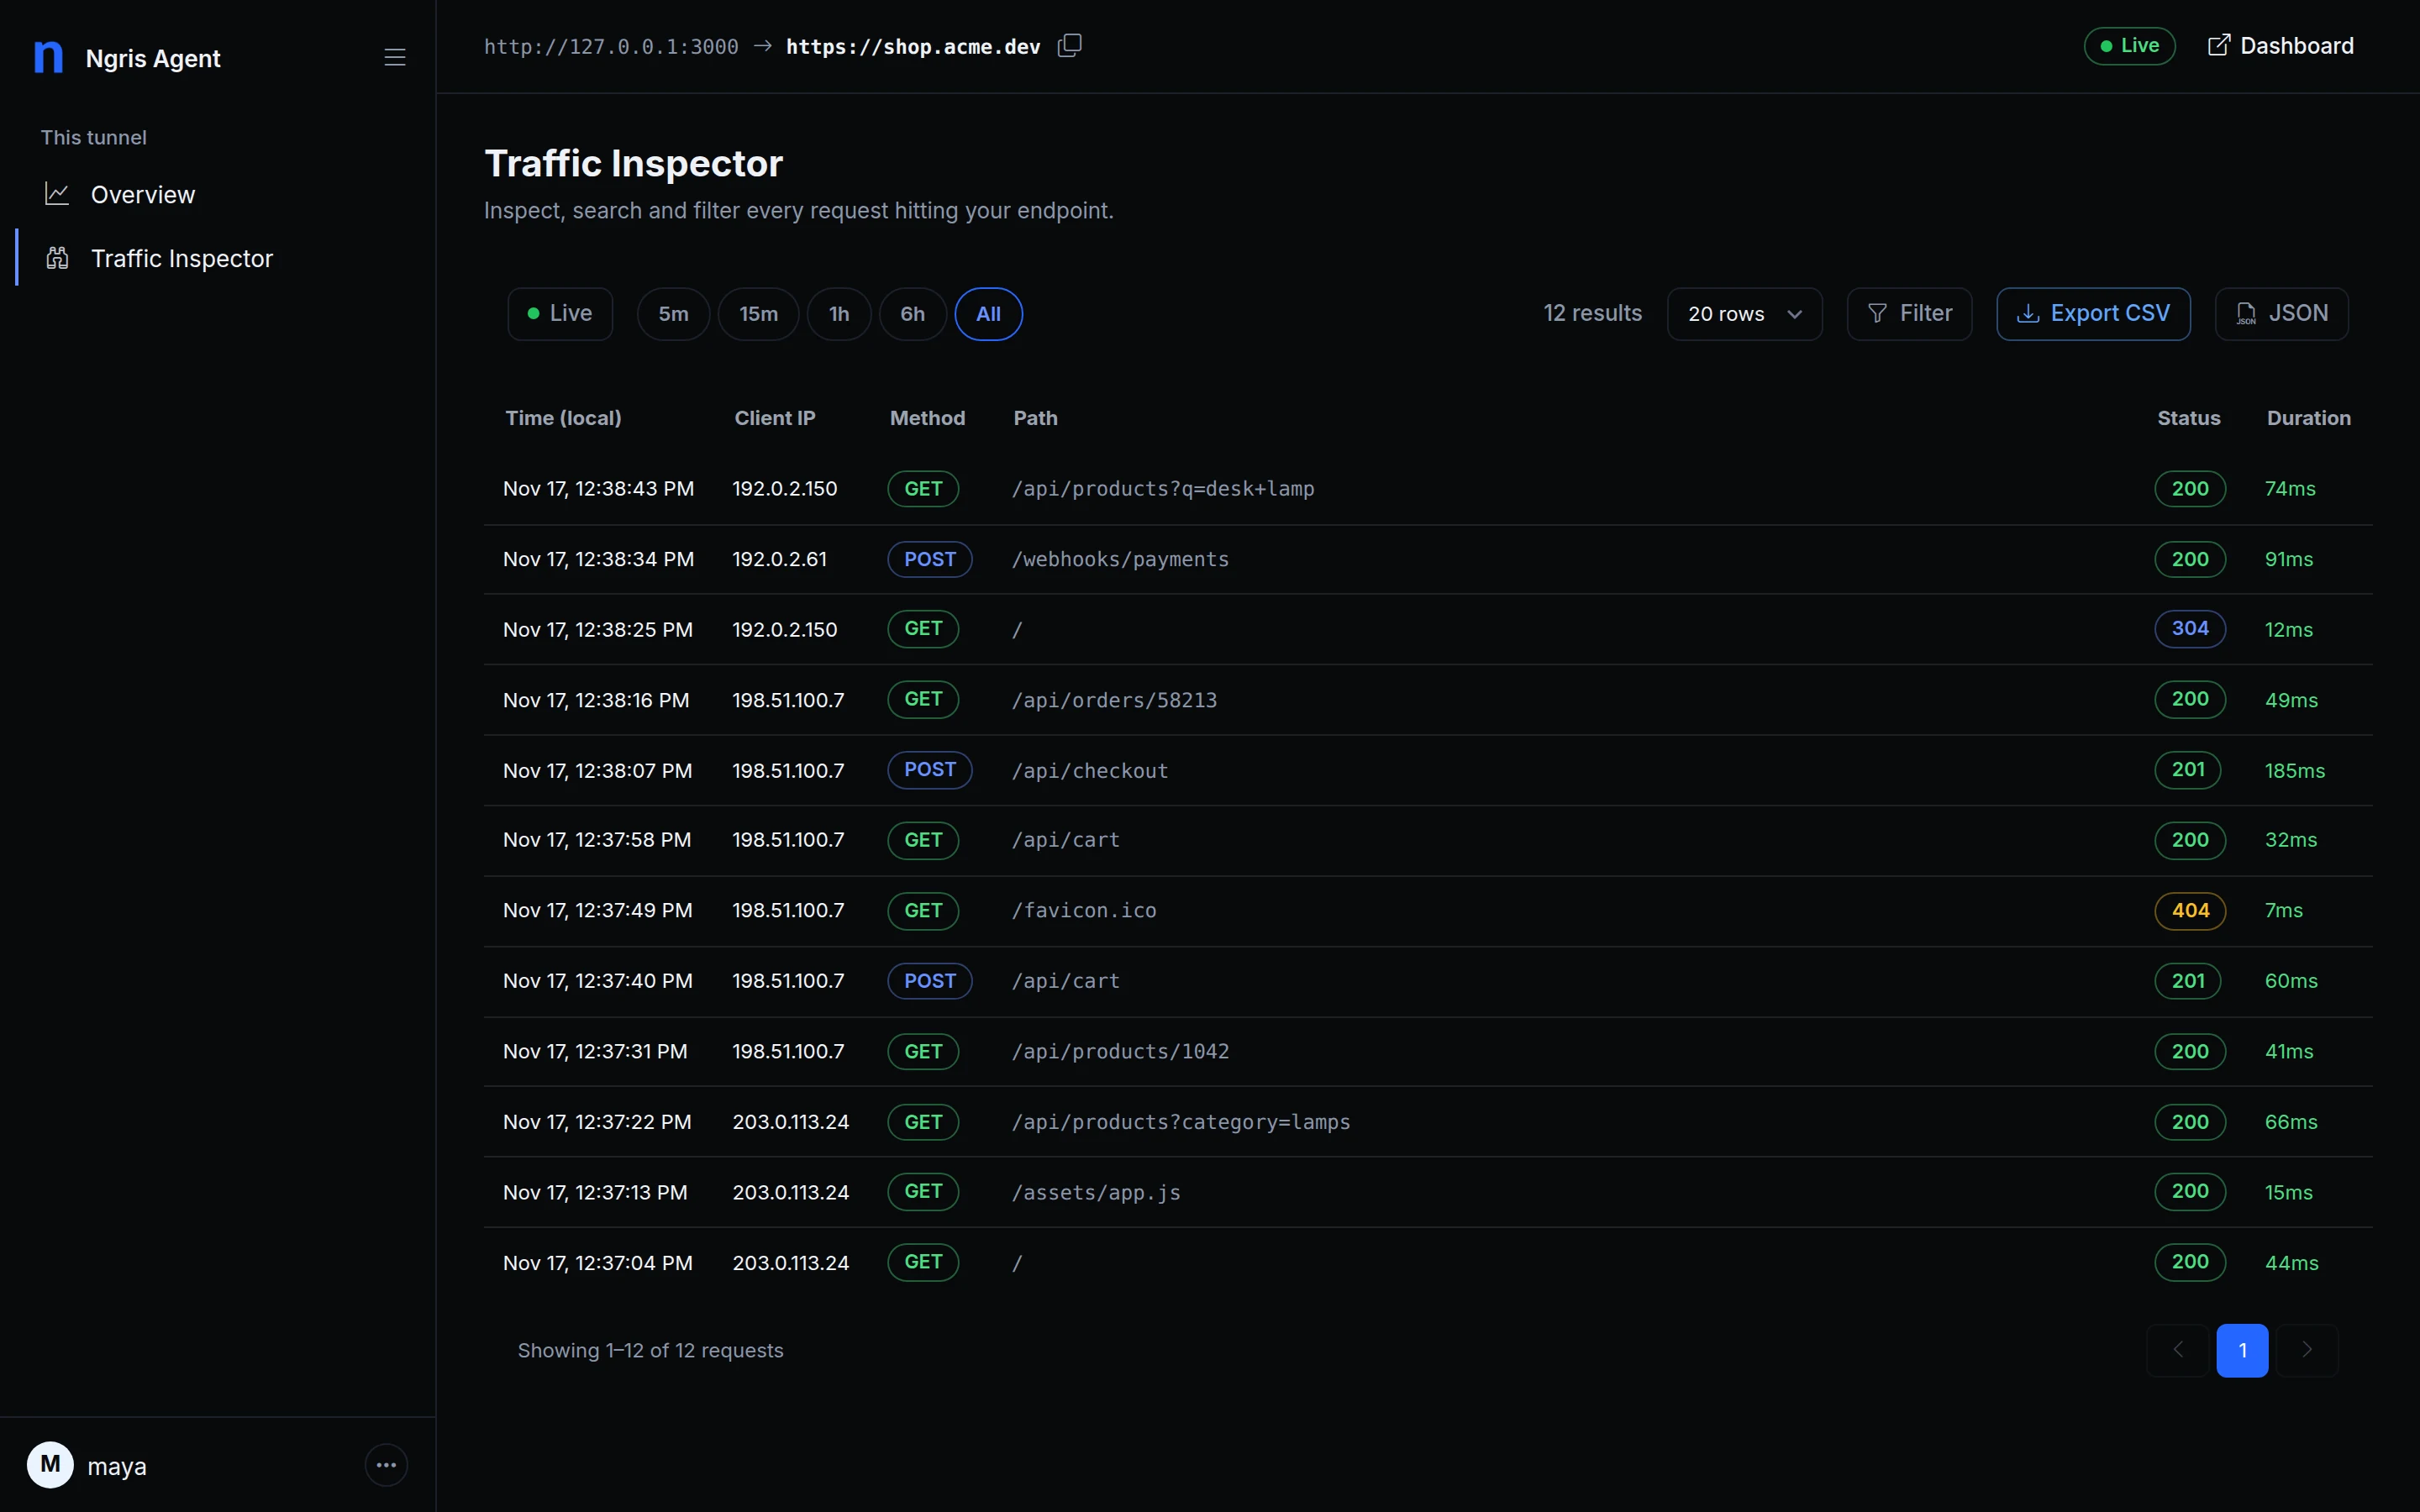
While a tunnel runs, ngris serves a page on your own machine (http://localhost:9090 unless you set another port) with every request the tunnel carried. It had its own look, older than the dashboard's.
Now it is the dashboard: the same sidebar and top bar, number tiles and Traffic Inspector. Above, Maya watches the shop's traffic while she tests a checkout on her laptop.
What changed
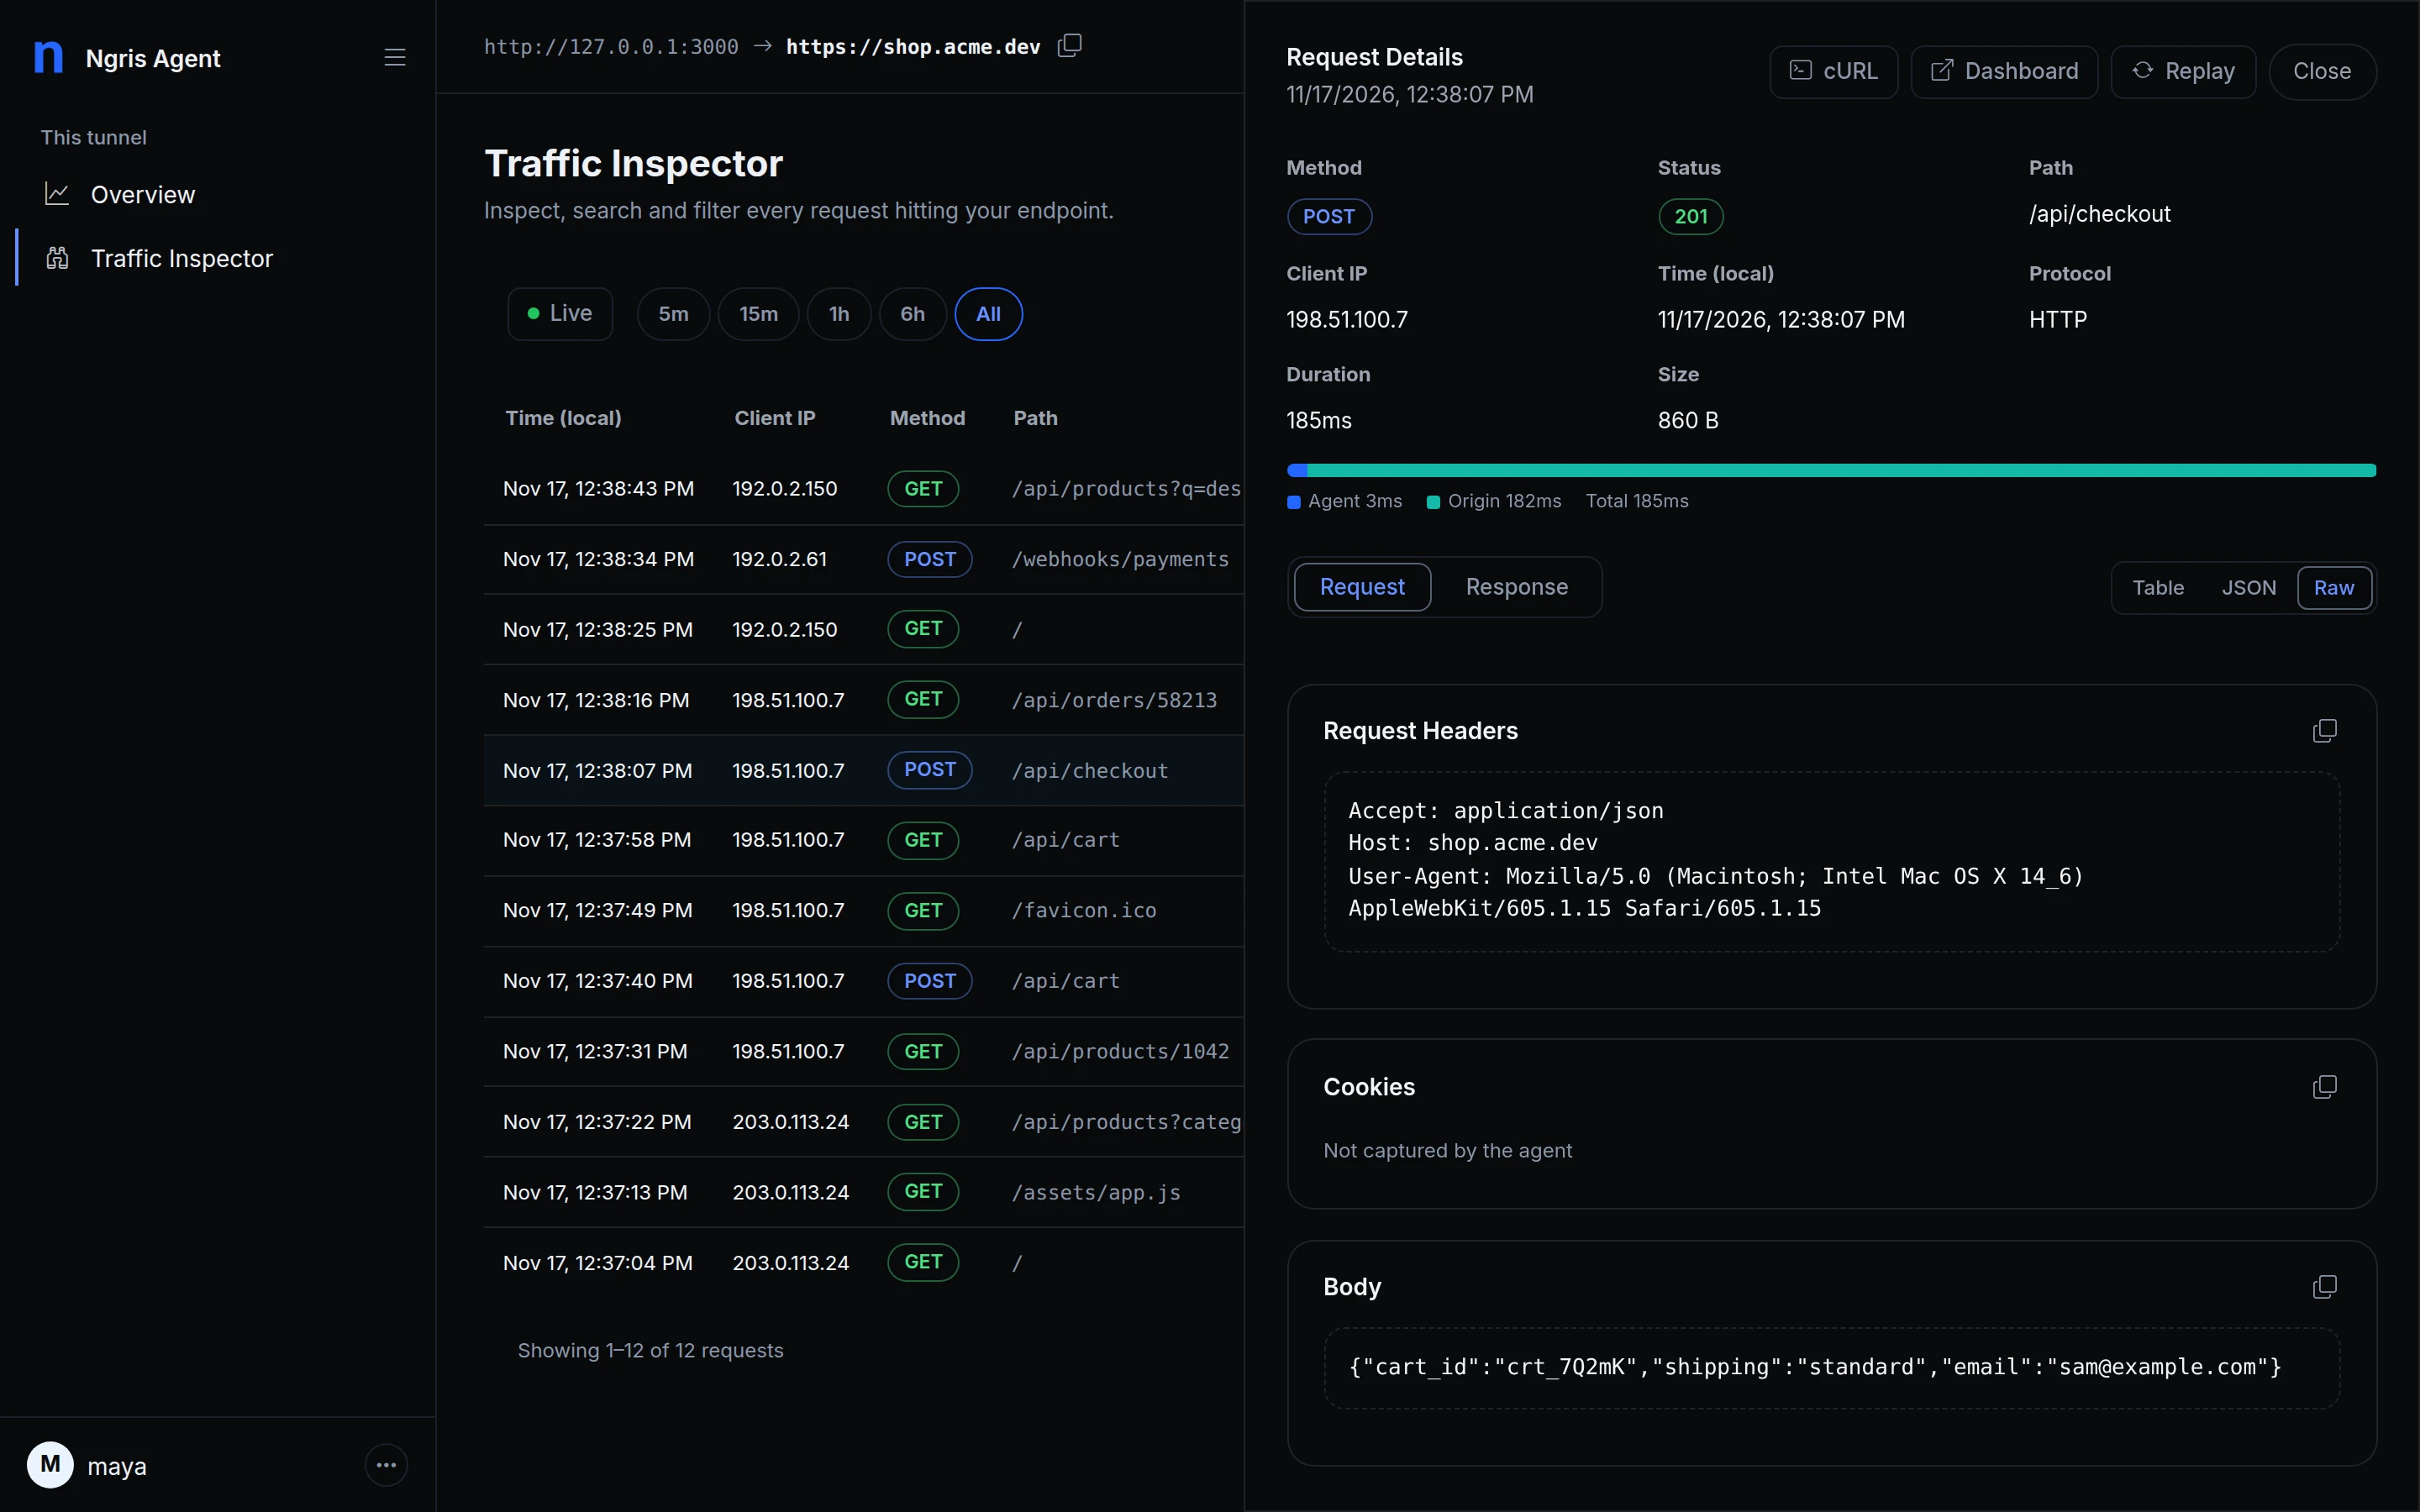
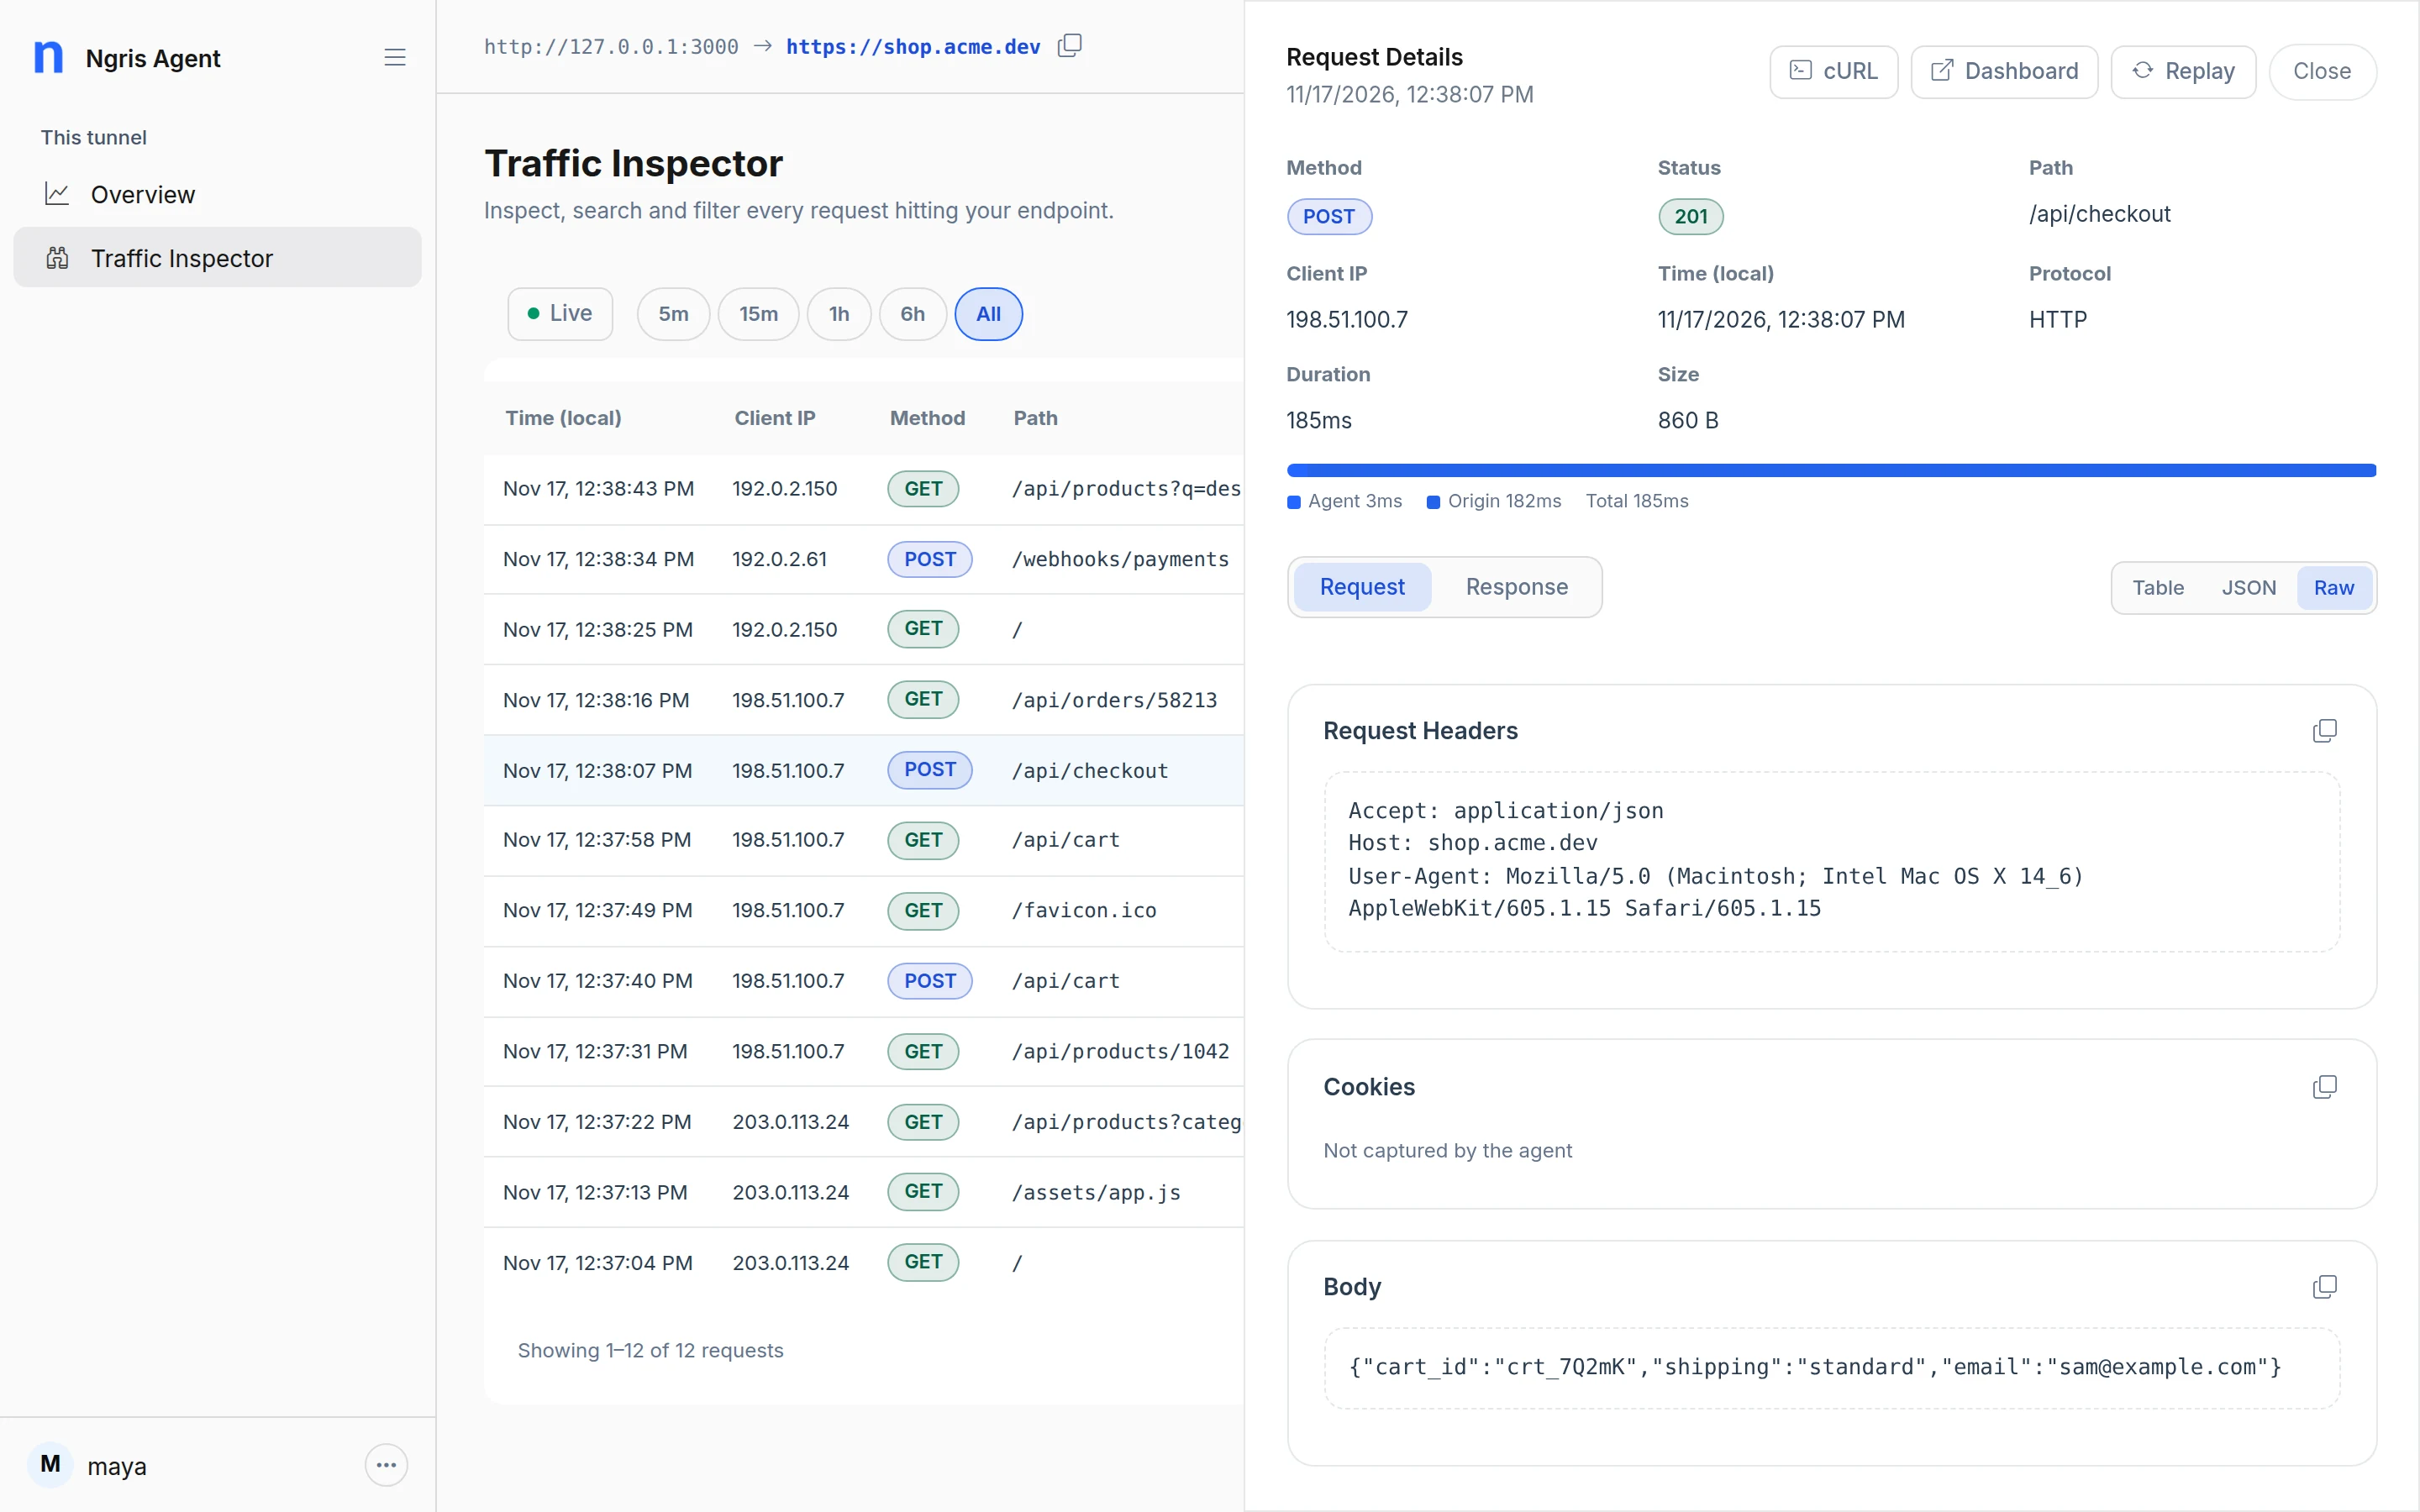
- The dashboard's layout. The same sidebar, top bar, tiles and Traffic Inspector table, painted by the dashboard's own stylesheets.
- The tunnel's address in the top bar, with a copy button and the live status beside it.
- Three themes. System, light and dark, from the account menu.
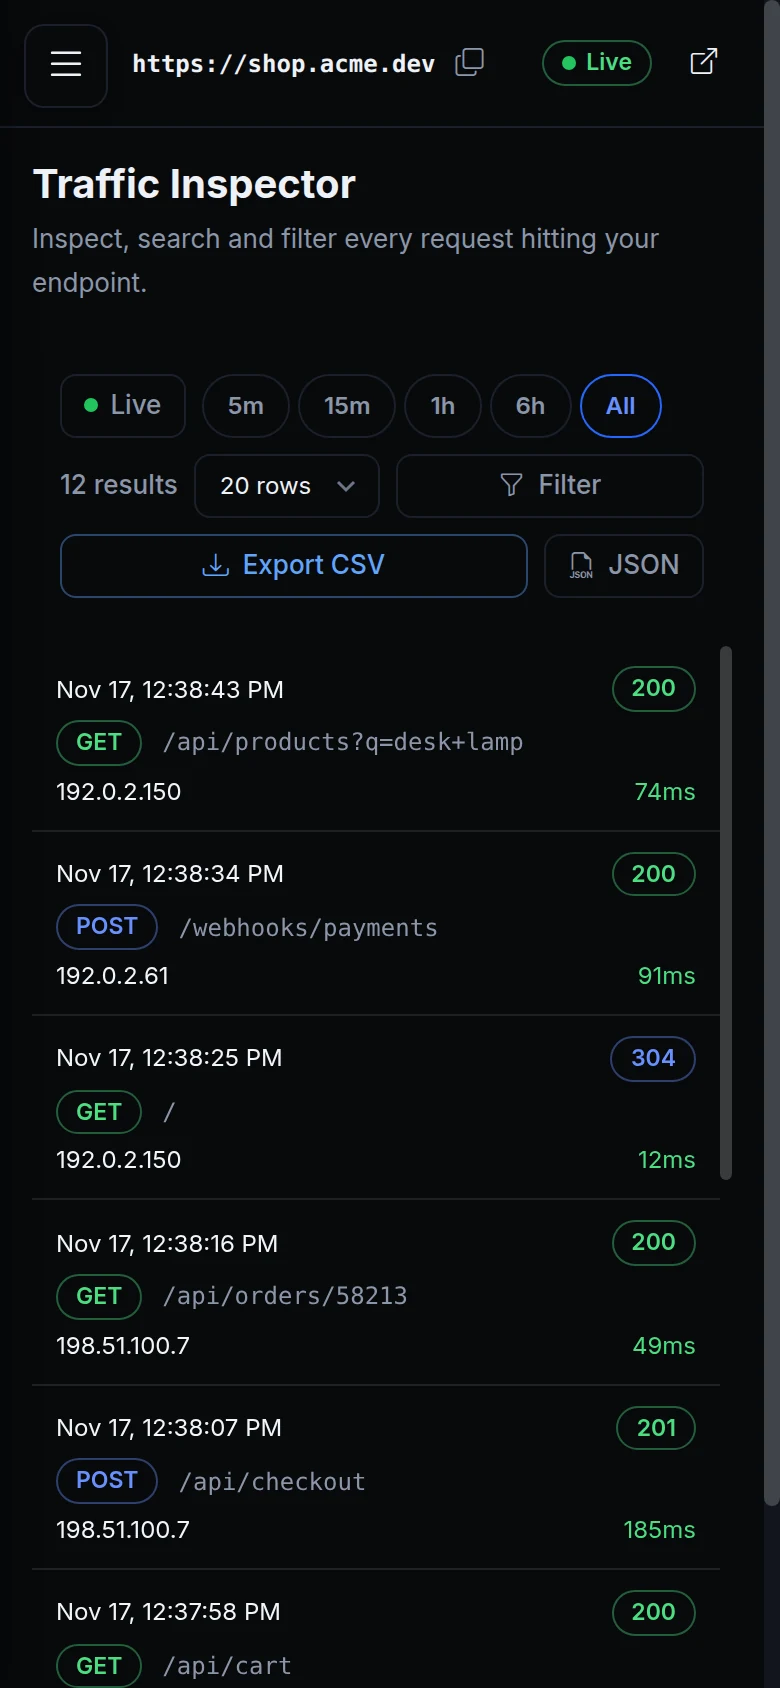
- A narrow window and a phone. The menu opens as a drawer, and each request is a card.
- Fixes. The traffic chart draws again; the menu opens in a window narrower than about 1000 px; cURL copies a command with the tunnel's address; the page says ngris in its title and sidebar.
- Nothing from the internet. Its fonts, icons and styles come with the agent.
Get started
- Update ngris to 0.5.0 and start a tunnel, for example
ngris http 3000. - Open
http://localhost:9090(or the port you set) in your browser. - Read the docs: The local Traffic Inspector.