New — Iris AI drafts your firewall, routing & rate-limit rules. Explore AI features →
Changelog
DashboardAccount

Usage & Limits: every limit at a glance

One ring for every limit: amber from 80%, red at the limit, and a sidebar badge that warns you before a create fails.

Usage & Limits: every limit at a glance

To see how much headroom you had, you opened several pages, and each one drew its meters a little differently. Most of the time you found out about a limit when a create failed.

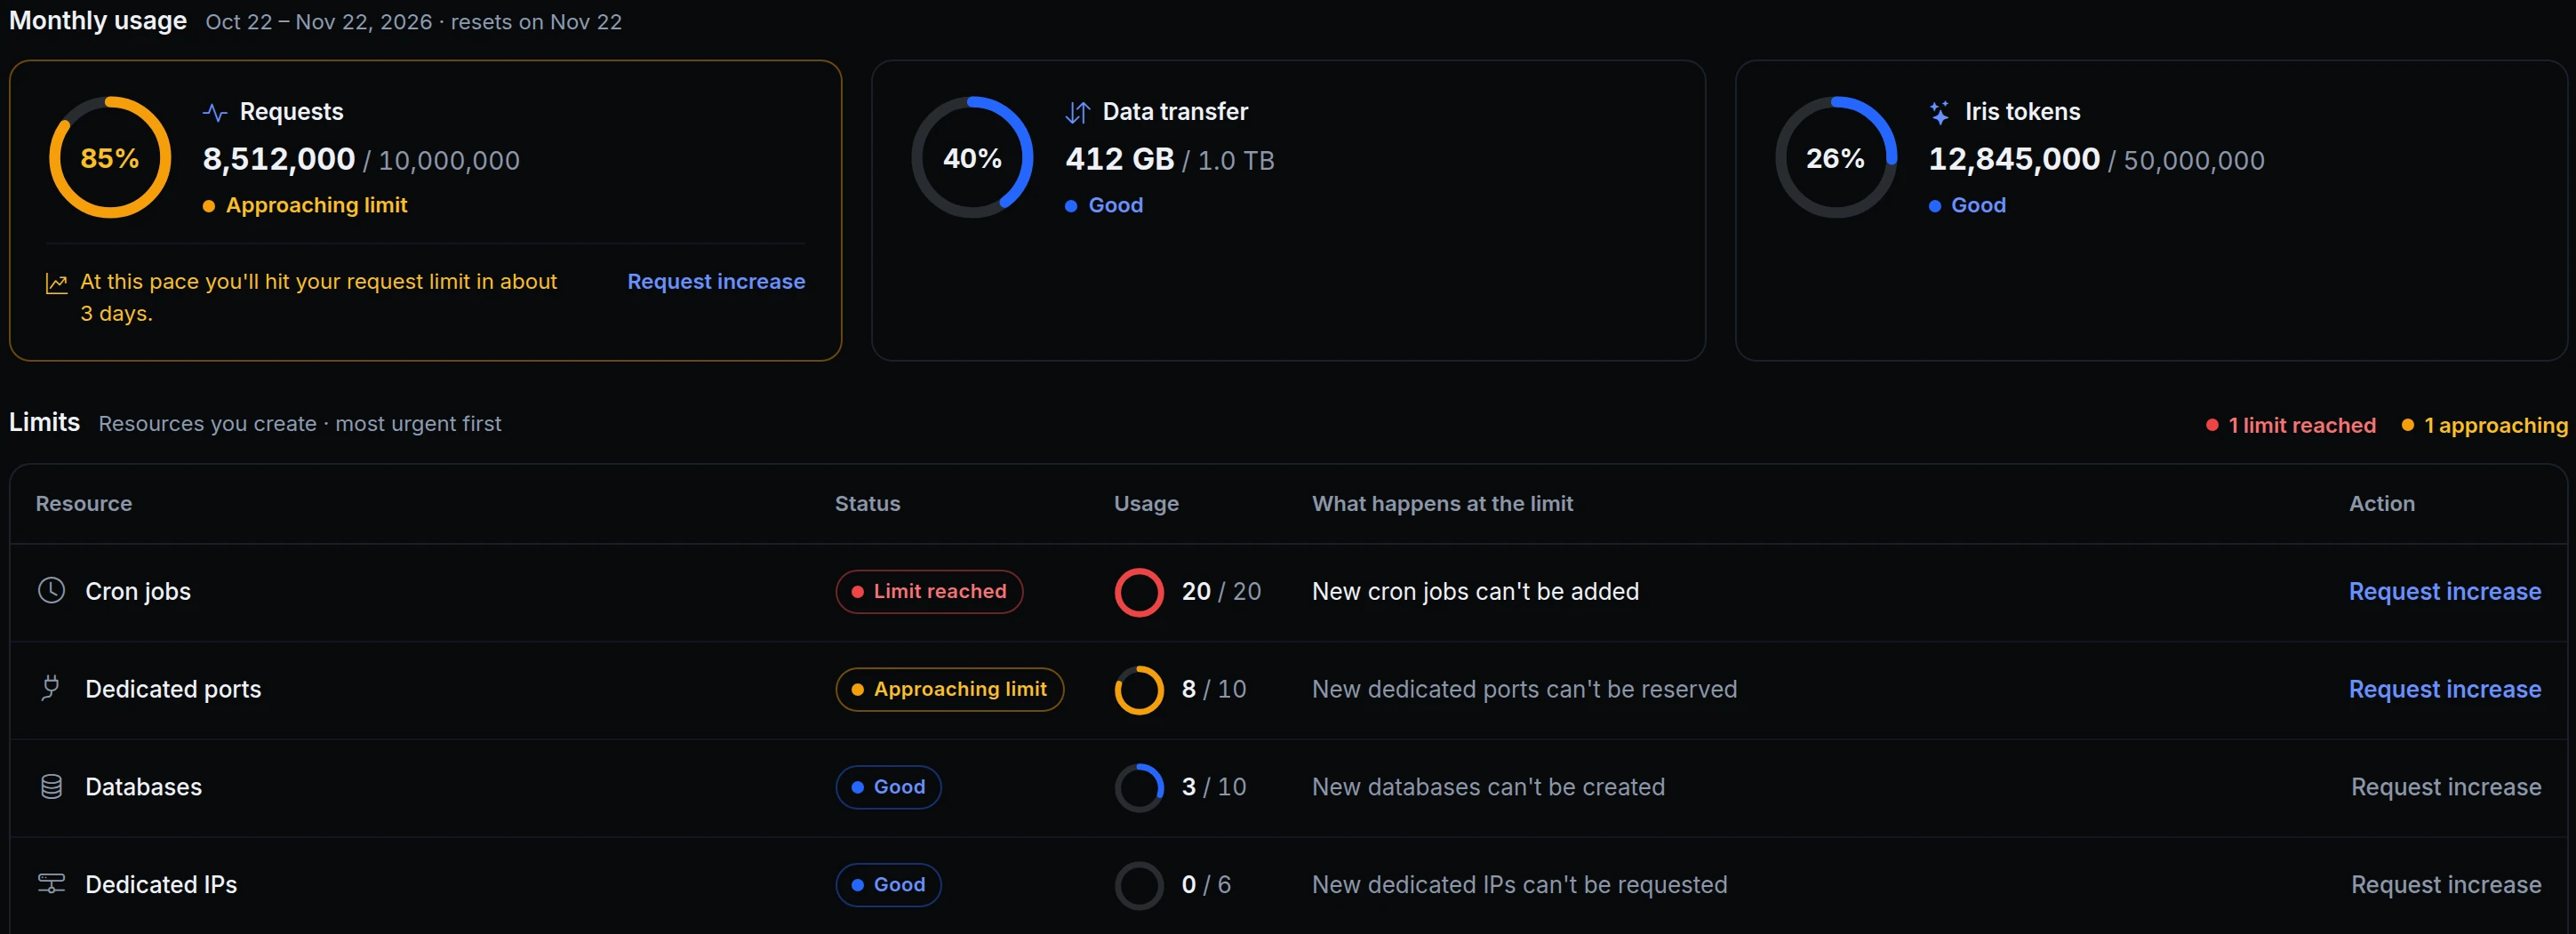
Usage & Limits now shows everything on one page, with one ring for every limit and one rule for all of them. A ring turns amber at 80% (Approaching limit) and red at 100% (Limit reached). The dashboard home, Billing and AI activity use the same ring.
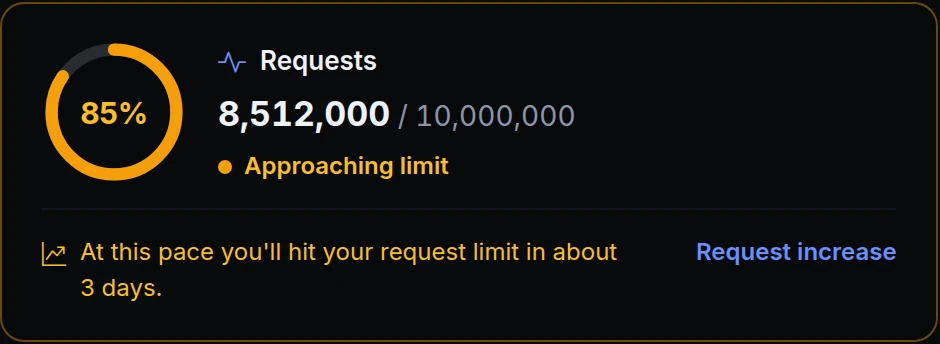
The Requests card: a ring at 85% in amber, 8,512,000 of 10,000,000 requests, Approaching limit, and a forecast of about 3 days
Acme Labs has used 85% of this month's requests, so the ring is amber and the card adds a forecast: at this pace, the rest runs out in about 3 days. Request increase opens a support ticket with these numbers filled in.
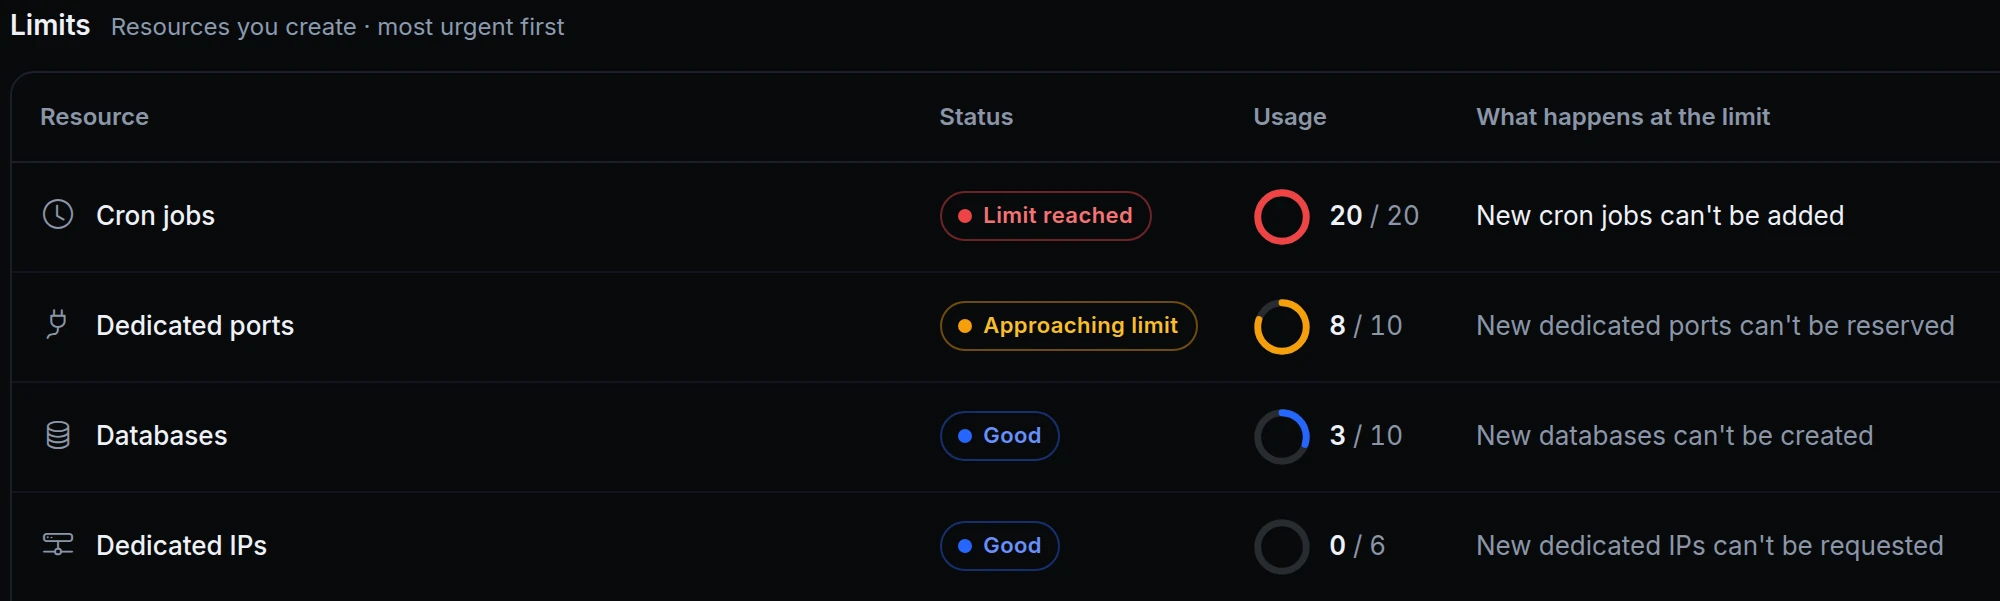
The Limits table: Cron jobs at 20 of 20 with Limit reached, Dedicated ports at 8 of 10 with Approaching limit, Databases and Dedicated IPs Good
Below the monthly usage, the Limits table puts the urgent rows first. All 20 cron jobs are in use and dedicated ports are close, and each row says what happens at the limit.
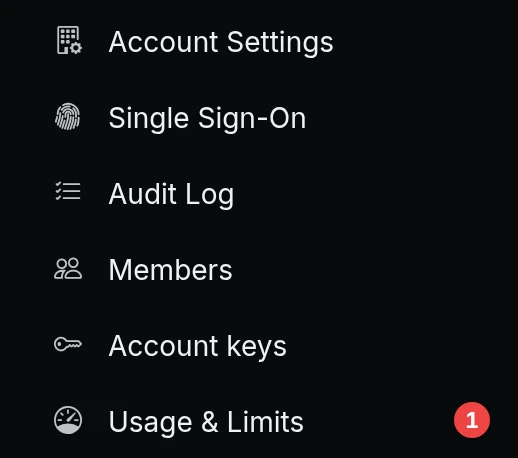
The sidebar: Usage & Limits with a red badge showing 1
The red 1 next to Usage & Limits shows on every page, so Acme knows before trying to add another cron job.

What's on the page

  • Monthly usage. Requests, Data transfer and Iris tokens, each with a large ring and its status. When you're on pace to run out before the month ends, the card says when.
  • Limits. Every resource you create (endpoints, tunnels, domains, databases, team members and more), most urgent first, with what happens at the limit, such as "New cron jobs can't be added".
  • One rule everywhere. Good below 80%, Approaching limit from 80%, Limit reached at 100%, and Over the limit past it. Rows without a cap say Unlimited.
  • The sidebar badge. A red count when limits are reached, an amber dot when some are approaching.
  • More room when you need it. Request increase opens a support ticket with your usage already filled in.

Get started

  1. In the dashboard, go to Account → Usage & Limits.
  2. On the Usage tab, check the Monthly usage rings and the Limits table.
  3. Keep an eye on the badge next to Usage & Limits in the sidebar: red means a limit is reached, amber means one is close.
  4. Not sure where you'll land this month? Click Will I hit a limit? at the top of the page and Iris reads your usage and tells you which limits you're closest to.

Read the docs

Ask an AI to summarise this page
Deploy
App hosting Edge functions Domains & certificates
Connect
Secure tunnels API gateway Multi-region edge
Protect
Bot protection & challenge WAF & firewall Edge login
Observe & AI
Monitoring Inspector & replay Iris AI MCP server AI Gateway
Developers
Developer tools Docs ngrok policy converter Blog Changelog
Compare
Ngris vs ngrok Ngris vs Cloudflare Tunnel Ngris vs Vercel Ngris vs Netlify Expose localhost guide
More
Solutions Pricing Enterprise Sign in Get Started Free